What’s new in Netflix business model: Q1 2023 investor update
Analysis and commentary of Netflix’ shareholder update from a business model perspective
In this update we will discuss the topics of customer acquisition cost, customer retention (i.e. customer lifetime value), engagement metrics, market share and the competitive landscape using Netflix’ recent quarterly report.
The key topics that Netflix covered in this updates are relating to:
Here is how their updates look in the biz model canvas (in blue quotes from their update):
Check out the video version of this article
Check out the video version of this article or the update on Q2 2023. Best to check both as they are building on each other. You can do so in any sequence.

Netflix shareholder letter Q1 2023 growth opportunities shown in the Biz Model Canvas. Blue parts are direct quotes from their letter (see below).
Here their update to shareholders Q1 2023 in their words:
“As our Netflix Top 10 lists show, people have very diverse tastes. To please our members we need to connect them with a title they’ll love in that moment – whether it’s an elevated drama, comedy, action adventure or reality show, versus simply engagement for engagement’s sake. The more we can consistently deliver the right titles to the right audiences at the right time, the more our members will choose Netflix when they next turn on their TV or recommend our service to their friends. It’s a virtuous flywheel, which is why our content teams are so focused on working with the best creators, and the variety and quality of our slate. In March, for example, All Quiet on the Western Front (the Oscar and BAFTA winning film) and Too Hot To Handle Germany hit our German Top 10 – two very different must watch, much loved titles that speak to the breadth of our programming ambitions.
Engagement is important to success in streaming because it drives both retention (increased member satisfaction) and acquisition (greater word of mouth). The third party data in the chart below shows that Netflix and YouTube are the clear leaders in streaming engagement – and that the opportunity ahead is significant as streaming still accounts for the minority of viewing in every country. We remain highly confident that streaming’s share of engagement will continue to grow at the expense of linear since it offers a better experience (on demand, availability across devices). We believe this gives Netflix tremendous room for growth if we can continue to improve our service – increasing our share of total viewing by multiples higher than today’s 2-4% share in Brazil, Mexico and Poland, or 7- 9% share in the US and the UK.”
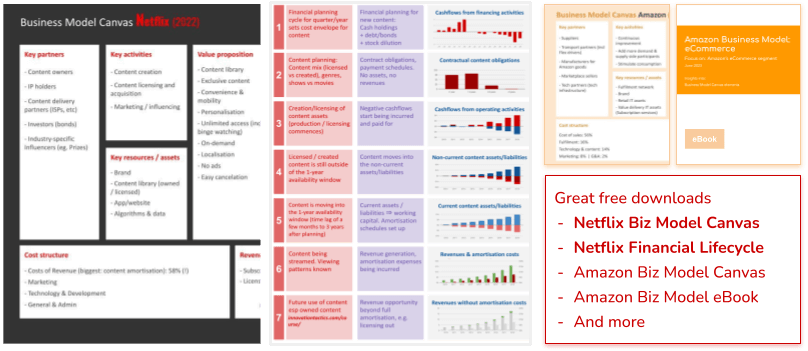
Free Downloads
Netflix' Share of viewing
Now let’s look at the data that Netflix present (which is sourced from media insights company Nielsen).

Netflix’ presentation of Nielsen data on selected market share / share of viewing data
Growth opportunities
Based on this Netflix sees large growth opportunities:
Participate in the anticipated growth of market penetration of streaming from 34% in the US and respectively in the other countries shown
Increase their share within the portion captured by streaming (which of course is a hugely competitive market)
The line of reasoning is that there is still a lot more market share left to be taken over from linear programming (i.e. free & cable TV)
In addition, they are suggesting that countries lagging the streaming trend of the leading countries would catch up over time


The shareholder update from a business model perspective
Let’s look at their quarterly shareholder update from a business model perspective in more detail.
Netflix business model works through renewed content creation which is at the heart of their business. See below the short term content lifecycle from a consumer perspective. Below are the some selected top 10 stats from 2022 & 2023. We can see the number of streams per title as well as how many weeks they were in the top 10. The latter is very rarely exceeding 5 weeks (let alone 10).
This is a very short duration compared to the often 1-2 year long creation cycle. With that there is a huge difference between the actual financial and business model lifecycle of their content assets and the consumer perspective thereof. The consumer literally only sees the tip of the iceberg
But is is also obvious how they manage to build demand for this content. This becomes obvious from the huge number of streams (some titles exceed 100m streams) in the timeframe of weeks.

Selected weeks of Netflix Top 10 with record “weeks in top 10” and “hours viewed” in 2022 and 2023
The content created by their creative staff forms the “slate of titles”. Good titles are displayed to the right audience (via the recommendation algorithms) at the right time.
Engagement --> customer lifetime value (CLV): As Netflix states, this increases customer retention, thus customer lifetime value.
Engagement --> reduced customer acquisition cost (CAC): It increases engagement, thus the likelihood of word-of-mouth to friends and with that reduces customer acquisition cost.
Engagement also drives the desired metrics seen in the charts above as well as the share of viewing which is a market share and engagement (thus usage) metric.
Last but not least, they implicitly state or assume that the same formula should work in those countries that they are targeting.
This is how we should read and understand the above section of their shareholder letter and quarterly report Q1 2023 in a nutshell.
Revenue model updates in this report included (1) "extra memberships" related to the password sharing crackdown; (2) lower prices for countries with lower incomes (the wider application thereof) and (3) an update on the ad-supported pricing layer. We are discussion all of these in the commentary section below.
Our Flagship Course

Commentary: competitive landscape & revenue models
Let’s add some commentary to this. While some of it may sound negative it is purely educational commentary and not intended to confirm nor refute what Netflix said.
Netflix does not cover all the different types of content that are available on streaming + linear, e.g. they don't cover the large areas of sports, news, live events & live shows, music, shorts.
They are also not covering the millions of subtastes as does YouTube. This simple doesnt work from the perspective of their business model. Netflix is a linear business model and these types of model only work well at scale of assets (in this case content assets)
Netflix: <10,000 movies / shows at any given time - currently 6,200;
Prime video ~10k; Disney ~2k; Apple TV+ ~200; Apple TV ~55k; (same source as above)
YouTube:
estimated >800m videos;
>50m channels covering a huge range of genres
They are implicitly comparing countries with lower GDP/capita (even when adjusted for purchase power parity, PPP) to each other and implying that people in such countries are willing to pay for streaming. Brazil’s GDP/capita (PPP) is some 75% lower and Mexico’s 70% lower than that of the US. Whether people have discretionary spending left for somethings that - for the better or worse - they can have for free (free TV and free cable TV) is a different question.
Note that Netflix has started to introduce lower prices in some countries. In a later section of their shareholder update they are calling out that a price reduction by 20-60% in India led to higher engagement and an increase of adoption from 19% growth prior to the adoption to 24% after it. Based on this they have introduced lower prices in 116 countries (which all up make less than 5% of their total revenue). It will be interesting to observe these developments. Whether these countries will be a major revenue contributor is anyone’s guess as far as we are concerned due to the fact that the content at an overall level is still quite US-taste (or western hemisphere taste) based.

GDP per capita adjusted for PPP (IMF) of Netflix’ targeted growth opportunity countries
On that note, see how relatively large YouTube is - and it almost certainly is the free - i.e. advertising-based - layer of YT.
This is probably also why Netflix is starting to offer a cheaper ad-based layer and state their satisfaction on this so far. Key points that they call out are: (1) that engagement in the ad-tier has only dipped to 95%; (2) that it hasn’t cannibalised their premium tier; (3) and that the Average Revenue per Membership (membership + ad revenue) is actually higher than a premium membership.
They call out that they are using Microsoft’s ad platform. Let’s keep in mind that YouTube’s parent Alphabet is the biggest player in digital ads and that YouTube are in the better position on this tier due to better targeting capability. Netflix has post code and device data in addition to the consumed content but that does not compare to the richness of data collected by Alphabet (for what it’s worth when it comes to advertising). Again, it’s is early days on this endeavour and results will remain to be seen.
They think they can increase market penetration from linear programming (cable and free TV). This is likely to be true for certain market segments, esp middle age, urban, affluent. But it may be less true for younger segments who may grow up with other formats, in particular shorter formats (FB Stories, TikTok and YouTube Shorts type content). As mentioned, Netflix’ business model does not lend itself for such content as it is not a platform business model.

In the US, Netflix’ share fell in the period between Aug ‘22 and Apr ‘23 with YouTube as the biggest winner. Netflix predicted a drop in engagement based on their password sharing crackdown (which the politely call “borrowing”): “As a reminder, as we roll out paid sharing – and as some borrowers stop watching either because they don’t convert to extra members or full paying accounts – near term engagement, as measured by third parties like Nielsen, will likely shrink modestly. However, we believe the pattern will be similar to what we’ve seen in Latin America, with engagement growth resuming over time as we continue to improve our programming and borrowers sign-up for their own accounts.” Was it not for this forewarning, the share price would have tanked in the following period rather than rallied (which it did).
The one other question is regarding the “extra membership” accounts related to the password crackdown is the question whether future (or even current) subscribers merge two otherwise separate memberships into one given that the “extra” membership costs less than a full standalone membership.
Netflix’ overall message on competition is that they focus on continuous improvement rather than mimicking every competitors move: “We don’t focus too much on the competition because we've learned over the years that consistently great execution (better movies, TV series, and now games, better discovery and buzzier, more creative marketing) is the key to our long term success. We succeed by getting a bit better, a bit faster than the competition every month.”
It was not our intention to disagree (or agree) with Netflix’ assumption of streaming posed to take market share from linear programming (nor with any of their other statements). We wanted to present their update from an educational business model perspective with additional commentary.
Disclaimer: None of our content, including this article, is intended to be investment advice or support any investment decisions. Our content is of a general educational nature. Please read our full T&Cs here.