What’s new in Netflix business model: Q2 2023 investor update
Analysis and commentary of Netflix’ shareholder update from a business model perspective
In this update we will discuss the main call outs of Netflix in their Q2 2023 investor update from 19 July.
The key topics that Netflix covered in this updates are relating to:
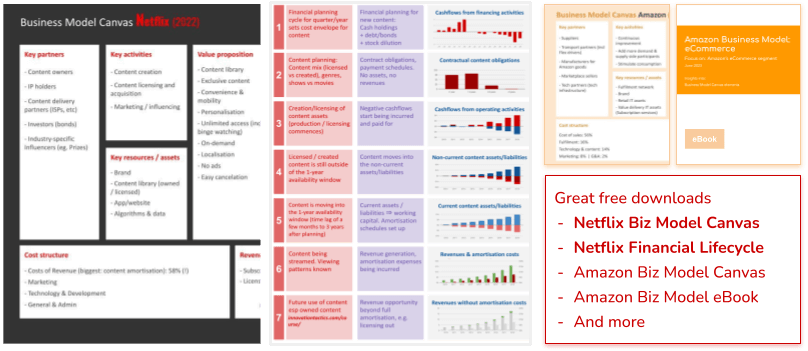
Business Model Canvas
Here is how their updates look in the biz model canvas in red are the key updates from the Q2 ‘23 investor update. In blue key updates from the Q1 2023 report.
Also called out in the bright yellow boxes are the updates in relation to their (new) advertising monetisation model. They have introduced is about 6 months ago and now rolling it out widely. It is seen as one of the long-term revenue growth options.

Netflix quarterly report Q2 2023: key updates shown in the business model canvas
Check out the video version of this article
Check out the Q1 and/or Q2 2023 shareholder update video. You can watch the videos in any sequence or just watch the Q2 video for now - please help us to spread the word by liking it:
Revenue model & monetisation
Let’s start by covering their updates on monetisation and revenue. These include:
Q2‘23 revenue of $8.2B and operating profit of $1.8B
5.9m new subscriber additions - beating the estimate
Q2’23 operating margin 22.3%
Revenue growth forecast of ~7.5% for Q3 supported by paid sharing plus continued growth in ad-supported plan
Here are some observations on these updates:
Main observation mainstream media: 5.9m sub addition → beating forecast
A 8% year-on-year (YOY) membership growth translated to 2.7% revenue growth
The main reasons for this are:
Lower quarterly Average Revenue per Member (ARM) due to addition late in the quarter for those accounts added through the “extra membership” (i.e. after the password sharing crackdown)
Higher mix of subscribers adds in lower-ARM countries due to the new pricing model (which reduced member fees for lower purchase power parity coutries). This was introduced throughout Q2 for ~100 countries
Fx adjustment
The improved operating margin of 22.3% (from 19.8%, Q2 ‘22) was due to “cost management” and slower h/c growth and changed timing of content spent. In reality most of this was due to the ongoing actors’ strike though this was not called out in the report at all (it was discussed in the interview)
Revenue growth FC Q3’23: 7.5% due mainly based on to subs-growth. ARM expected to be flat
The management’s decision was not to increase m’ship pricing at the same time while the other major initiatives were in full swing (password crackdown & extra m’ships, ad-layer rollout). These initiatives are not (yet) offsetting enough
Note: “Extra member” accounts are not included in paid m’ship count but as additional revenue included in ARM of the primary member
Growth opportunities
The main growth opportunities were called out during the interview:
“Extra member” accounts: expected to materialise over the next 1-3 quarters and triggered by new content
Advertising-based layer: >100% QOQ growth on a low base. The long-term goal is for this to be 10% of revenue but lots of work required
Growth currently driven by “volume”, i.e. new memberships. In 2-3 quarters they are aiming to increase pricing and more differentiated plans & features
New pricing for 116 countries: lower price points which aim to attract new subscribers which over time will be monetised through increased pricing layers, etc
Free Downloads
Netflix Enagement Metrics
Netflix had started to share their weekly Top-10 list which we have shown in our coverage of their Q1 ‘23 shareholder update. This time they have shared some additional engagement metrics as you can see below.
They have long called out the importance of engagement for their business model and monetisation. Here their workds:
“We focus on engagement because it's the best proxy we have for satisfaction. It’s also closely linked to retention, an important driver of our business. Key for Netflix members is the variety and quality of our content, with the understanding that quality is in the eye of the beholder.”
They are providing more engagement data on their Top-10 and encouraging others to do the same.
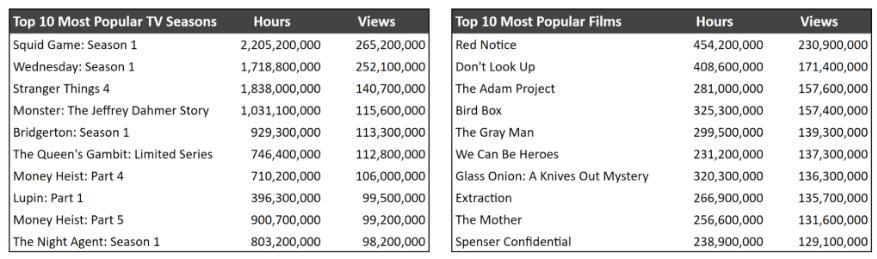
New aggregated engagement metrics shared by Netflix in addition to their weekly Top-10 [source: shareholder letter, Q2 2023]
Global Engagement Metrics
In addition to this, they have also started sharing global engagement metrics. The background to this is that different global audiences have different tastes:
“The combination of content variety and personalization means that each person easily finds titles they will love.”
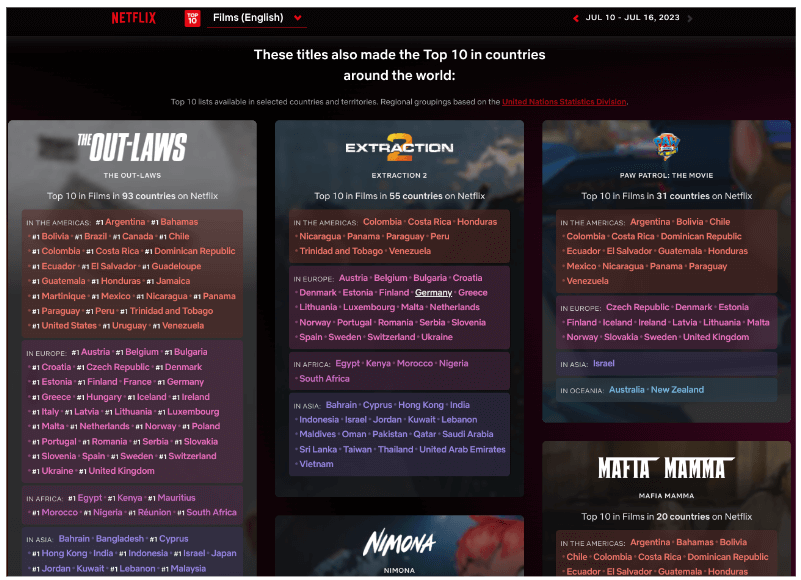
Netflix Global Top-10: new the listing of titles making it to the Netflix top-10 in various countries. Note that this is exactly what it says: a Netflix top-10. It is not a top-10 of the respective country across various streaming, TV, cable and other channels
We were very pleased that Netflix addressed in this update a point that we had covered at large in our Q1 ‘23 video. And that is the point of different tastes in different global cultures:
“if you aspire to serve hundreds of millions of people all around the world, you can’t program for one set of tastes or sensibilities”
“invest across genres, cultures and languages.”
“All these titles not only hit Netflix’s Top 10 list in their own country but also across multiple countries and our Global Top 10—showing that, with good subtitles and dubbing, plus easy discovery, great stories can truly come from anywhere and excite audiences everywhere …”
“Even in the US, which has historically had incredibly local viewing habits, we’ve seen non-English language titles gain increasing popularity.”
In this context, they are also pointing out their consistent first rankings in the US (across all tracked channels and not just Netflix).
It was great to hear about the topic of content variety catering for different cultures and tastes.
However, the questions that we raised last time, remain valid and difficult to answer:
In essence, the question is whether their financial means will allow to create sufficient content for the different globbal tastes to attract and sustainably retain a globally diverse audience.
Will others be able to strongarm Netflix out of local markets by focussing their financial means on suffienciently large markets. Take India as an example that is very large and culturally different enough to not be overly attracted by the largely Western-content (acknoledging the fact that Netflix is adding more diversity but is there enough content for an Indian audience in this example?)
These are questions that other entrepreneurs will ask and act upon. It will be fascinating to observe this space. Check out out Q1 article and video on this.
Engagement metrics & other key metrics
Engagement metrics are not a be-all and end-all. They affect key customer unit economic metrics:
Engagement --> customer lifetime value (CLV): As Netflix states, this increases customer retention, thus customer lifetime value.
Engagement --> reduced customer acquisition cost (CAC): It increases engagement, thus the likelihood of word-of-mouth to friends and with that reduces customer acquisition cost.
Our Flagship Course

Competition
The last major area of their shareholder update in this quarter pertains to competition
Genres
Here they are calling out major competing genres (that we already mentioned in our last article):
Movies/TV - direct competition across different channels
Sports, News
Gaming
Social Media
and other
Direct streaming competitors
Competitors from an entertainment background with their own large content libraries, such as:
Disney
Comcast/NBCU
Paramount Global and
Warner Brothers Discovery
And large tech competitors that have entered the content & media markets:
Apple,
Amazon and
YouTube
Note: linear programming (broadcast & cable) are not mentioned as competitors but merely as sources where more growth will come from.

Netflix shows the growth of streaming as part of US TV screen time over a 2 year period. While Netflix’ share went up from 6% to 8.2%, it’s also obvious how the number of competitors has increase over the same period
Summary
A fitting summary from a business model perspective from their quarterly report is the following excerpt:
“But while streaming is intensely competitive, we’ve shown that with strong execution and focus, it can be a great business. Long term success takes strength in both entertainment and technology, a combination that’s not been required of large media or tech companies in the past. It’s about one’s ability to work with the best creators; to produce and license movies, TV shows and ultimately games across multiple genres and languages globally; to create a stellar discovery engine; to build great partnerships and payments systems; and to continually pierce the zeitgeist with consumer passion and fandom. Improving across all these areas is key to ensuring that Netflix continues to lead the streaming.”
Key sources
Key source related to this article:
Further reading::


DISCLAIMER
It was not our intention to disagree (or agree) with Netflix’ assumption of streaming posed to take market share from linear programming (nor with any of their other statements). We wanted to present their update from an educational business model perspective with additional commentary.
Disclaimer: None of our content, including this article, is intended to be investment advice or support any investment decisions. Our content is of a general educational nature. Please read our full T&Cs here.